Tiedosto:Solid state electronic band structure.svg

Yhteenveto
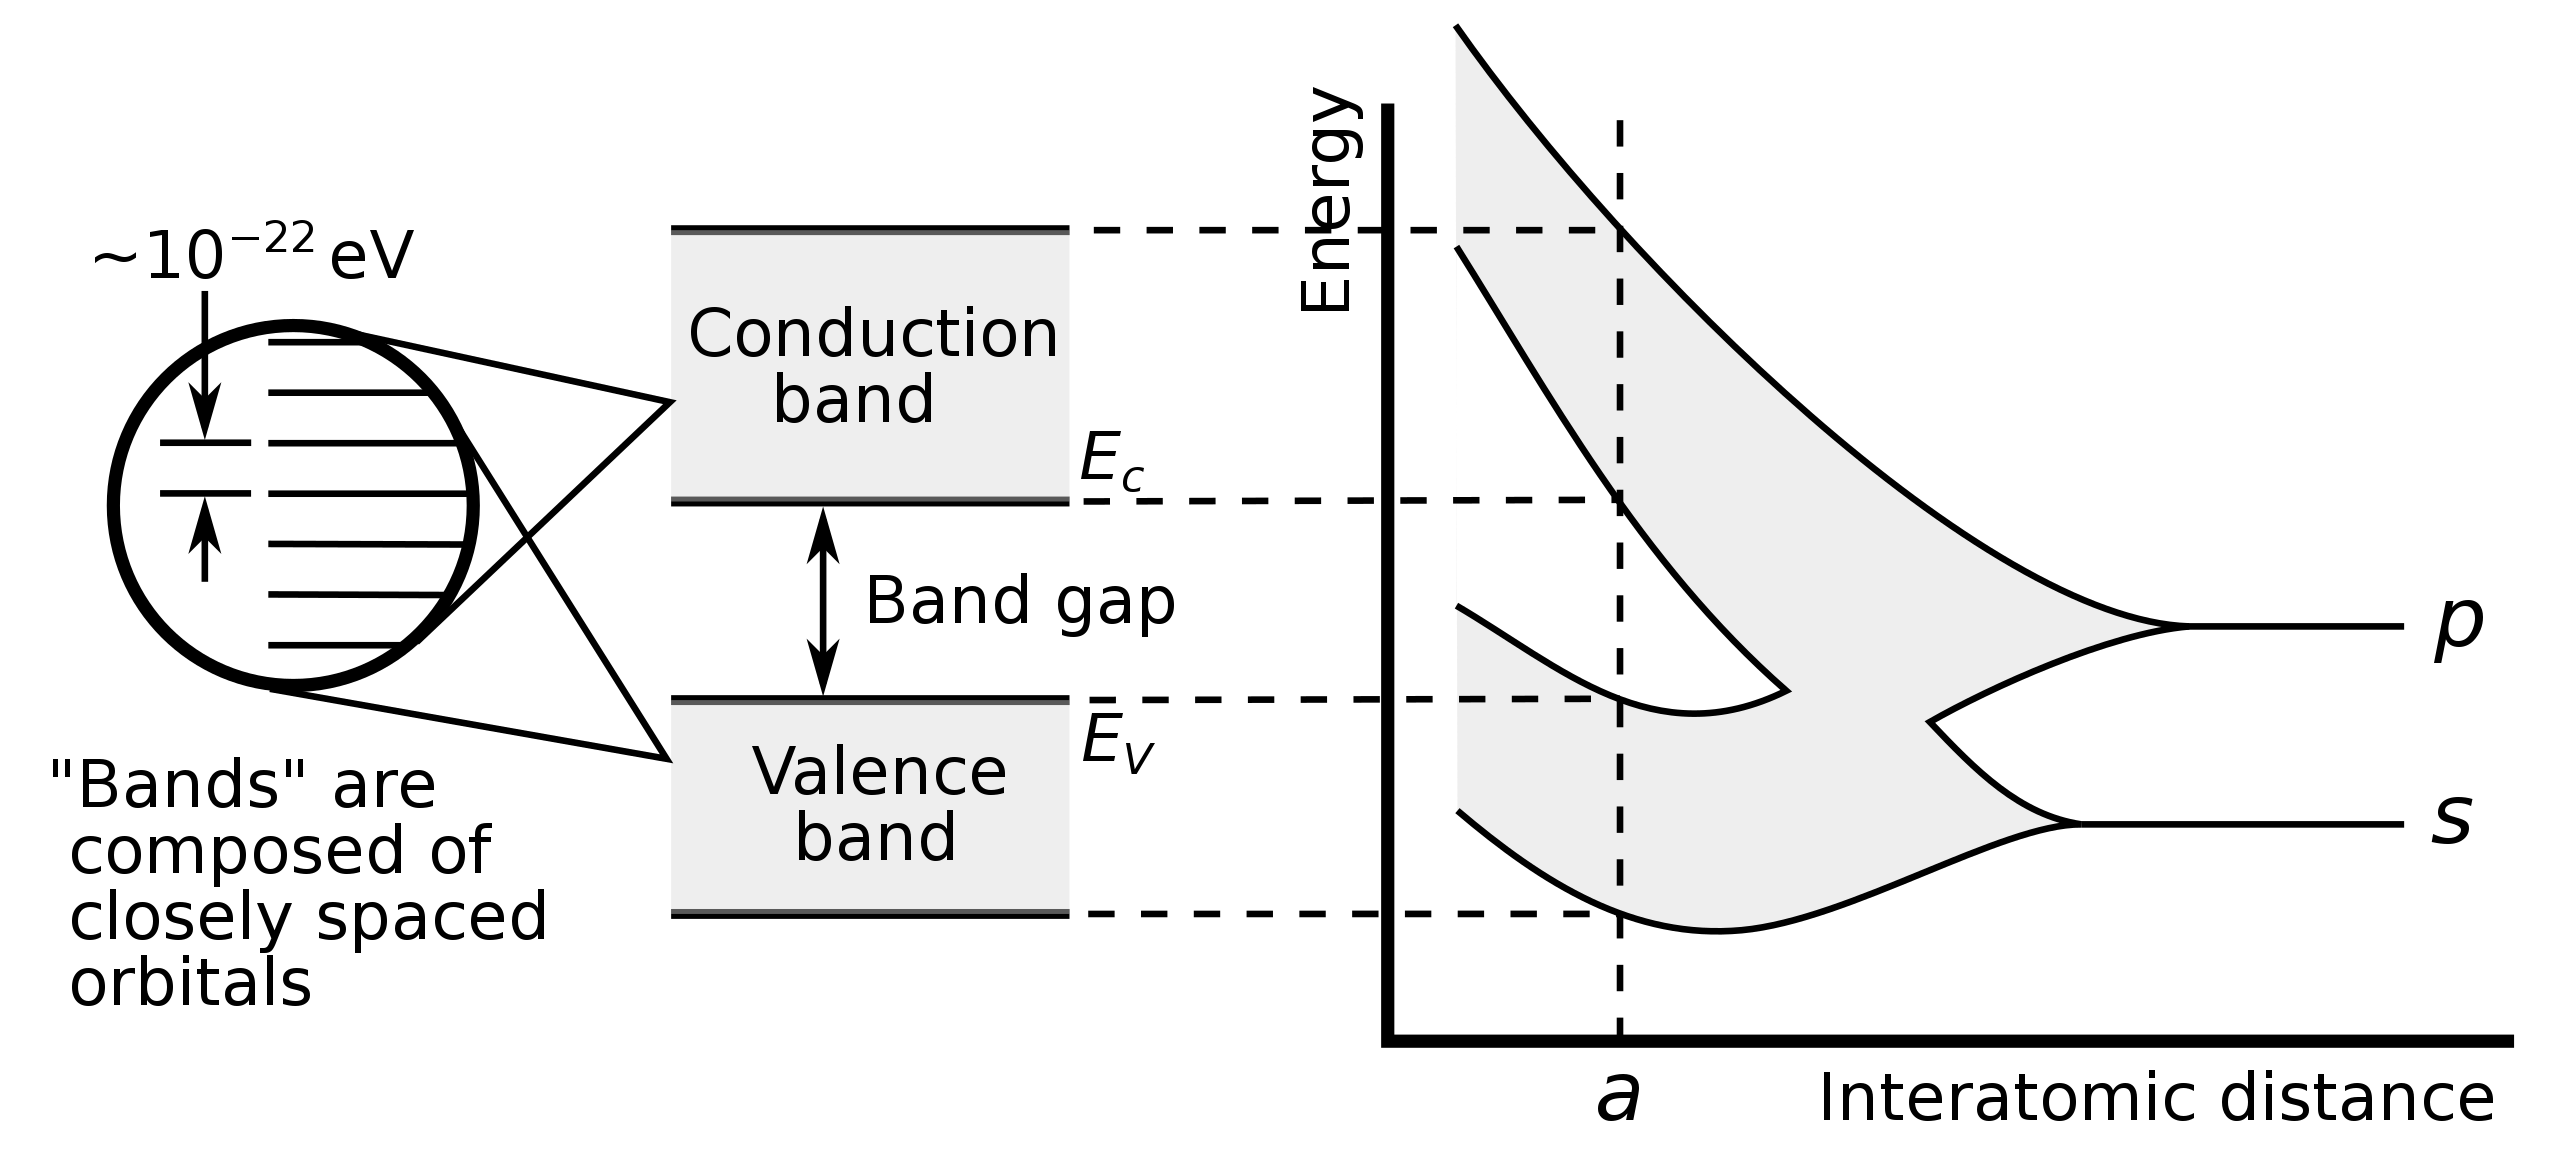
| Kuvaus |
English: Diagram illustrating how electronic band structure of a solid comes about by the hypothetical example of a large number of carbon atoms coming together to form a diamond crystal lattice. The graph (right) shows the energy levels of the atoms as a function of the spacing between atoms. When the atoms are far apart (right side of graph) each atom has valence atomic orbitals p and s which have the same energy. However when the atoms come closer together their orbitals begin to overlap. The Pauli Exclusion Principle dictates that no two atoms in a molecule can have electrons with the same quantum numbers, so each atomic orbital splits into N molecular orbitals each with a different energy, where N is the number of atoms in the crystal. Since N is such a large number (~1022) adjacent orbitals are extremely close together in energy (~10-22 eV) so the orbitals can be considered a continuous energy band.
a is the atomic spacing (lattice constant) found in an actual crystal lattice of carbon atoms (diamond lattice) so the band structure at that spacing is the one found in diamond. At that spacing the orbitals form two bands, called the valence band and conduction band, with an energy gap of 5.5 electron volts (eV) between them. The valence electrons fill the lower band. Electrons in this band are not mobile; while electrons in the higher conduction band can travel through the crystal from atom to atom, and thus serve as charge carriers to conduct electricity. Since the 5.5 eV band gap is much larger than the thermal energy of most electrons in the crystal, very few electrons acquire the energy to jump the gap and become conduction electrons. This is why diamond is an electrical insulator. Русский: Формирование зон при сближении атомов |
| Päiväys | |
| Lähde | Oma teos |
| Tekijä | Chetvorno |
| Muut versiot |
|
| SVG kehittely |


Lisenssi
| Tämä teos on julkaistu Creative Commons CC0 1.0 Yleismaailmallinen Public Domain -lausuman alaisuudessa. | |
| Henkilö, joka on yhdistänyt CC0:n teokseen tai viitannut siihen teoksessa, on luovuttanut teoksen vapaaseen yleiseen käyttöön (public domain) luopumalla maailmanlaajuisesti ja soveltuvan lainsäädännön sallimassa enimmäislaajuudessa kaikista tekijänoikeuslainsäädännön alaisista oikeuksistaan teokseen, lähioikeudet ja kaikki tekijänoikeuteen liittyvät oikeudet mukaan lukien. Teosta voi lupaa pyytämättä kopioida, muokata, levittää ja esittää, mukaan lukien kaupallisessa tarkoituksessa.
|
Tiedoston historia
Päiväystä napsauttamalla näet, millainen tiedosto oli kyseisellä hetkellä.
| Päiväys | Pienoiskuva | Koko | Käyttäjä | Kommentti | |
|---|---|---|---|---|---|
| nykyinen | 9. toukokuuta 2017 kello 03.58 | | 388 × 177 (29 KiB) | wikimediacommons>Chetvorno | Replaced invalid Inkscape SVG version with "plain SVG" version which passes validation |
Tiedoston käyttö
Seuraava sivu käyttää tätä tiedostoa: