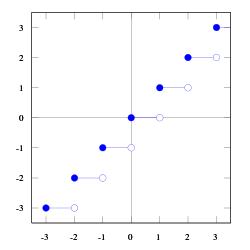
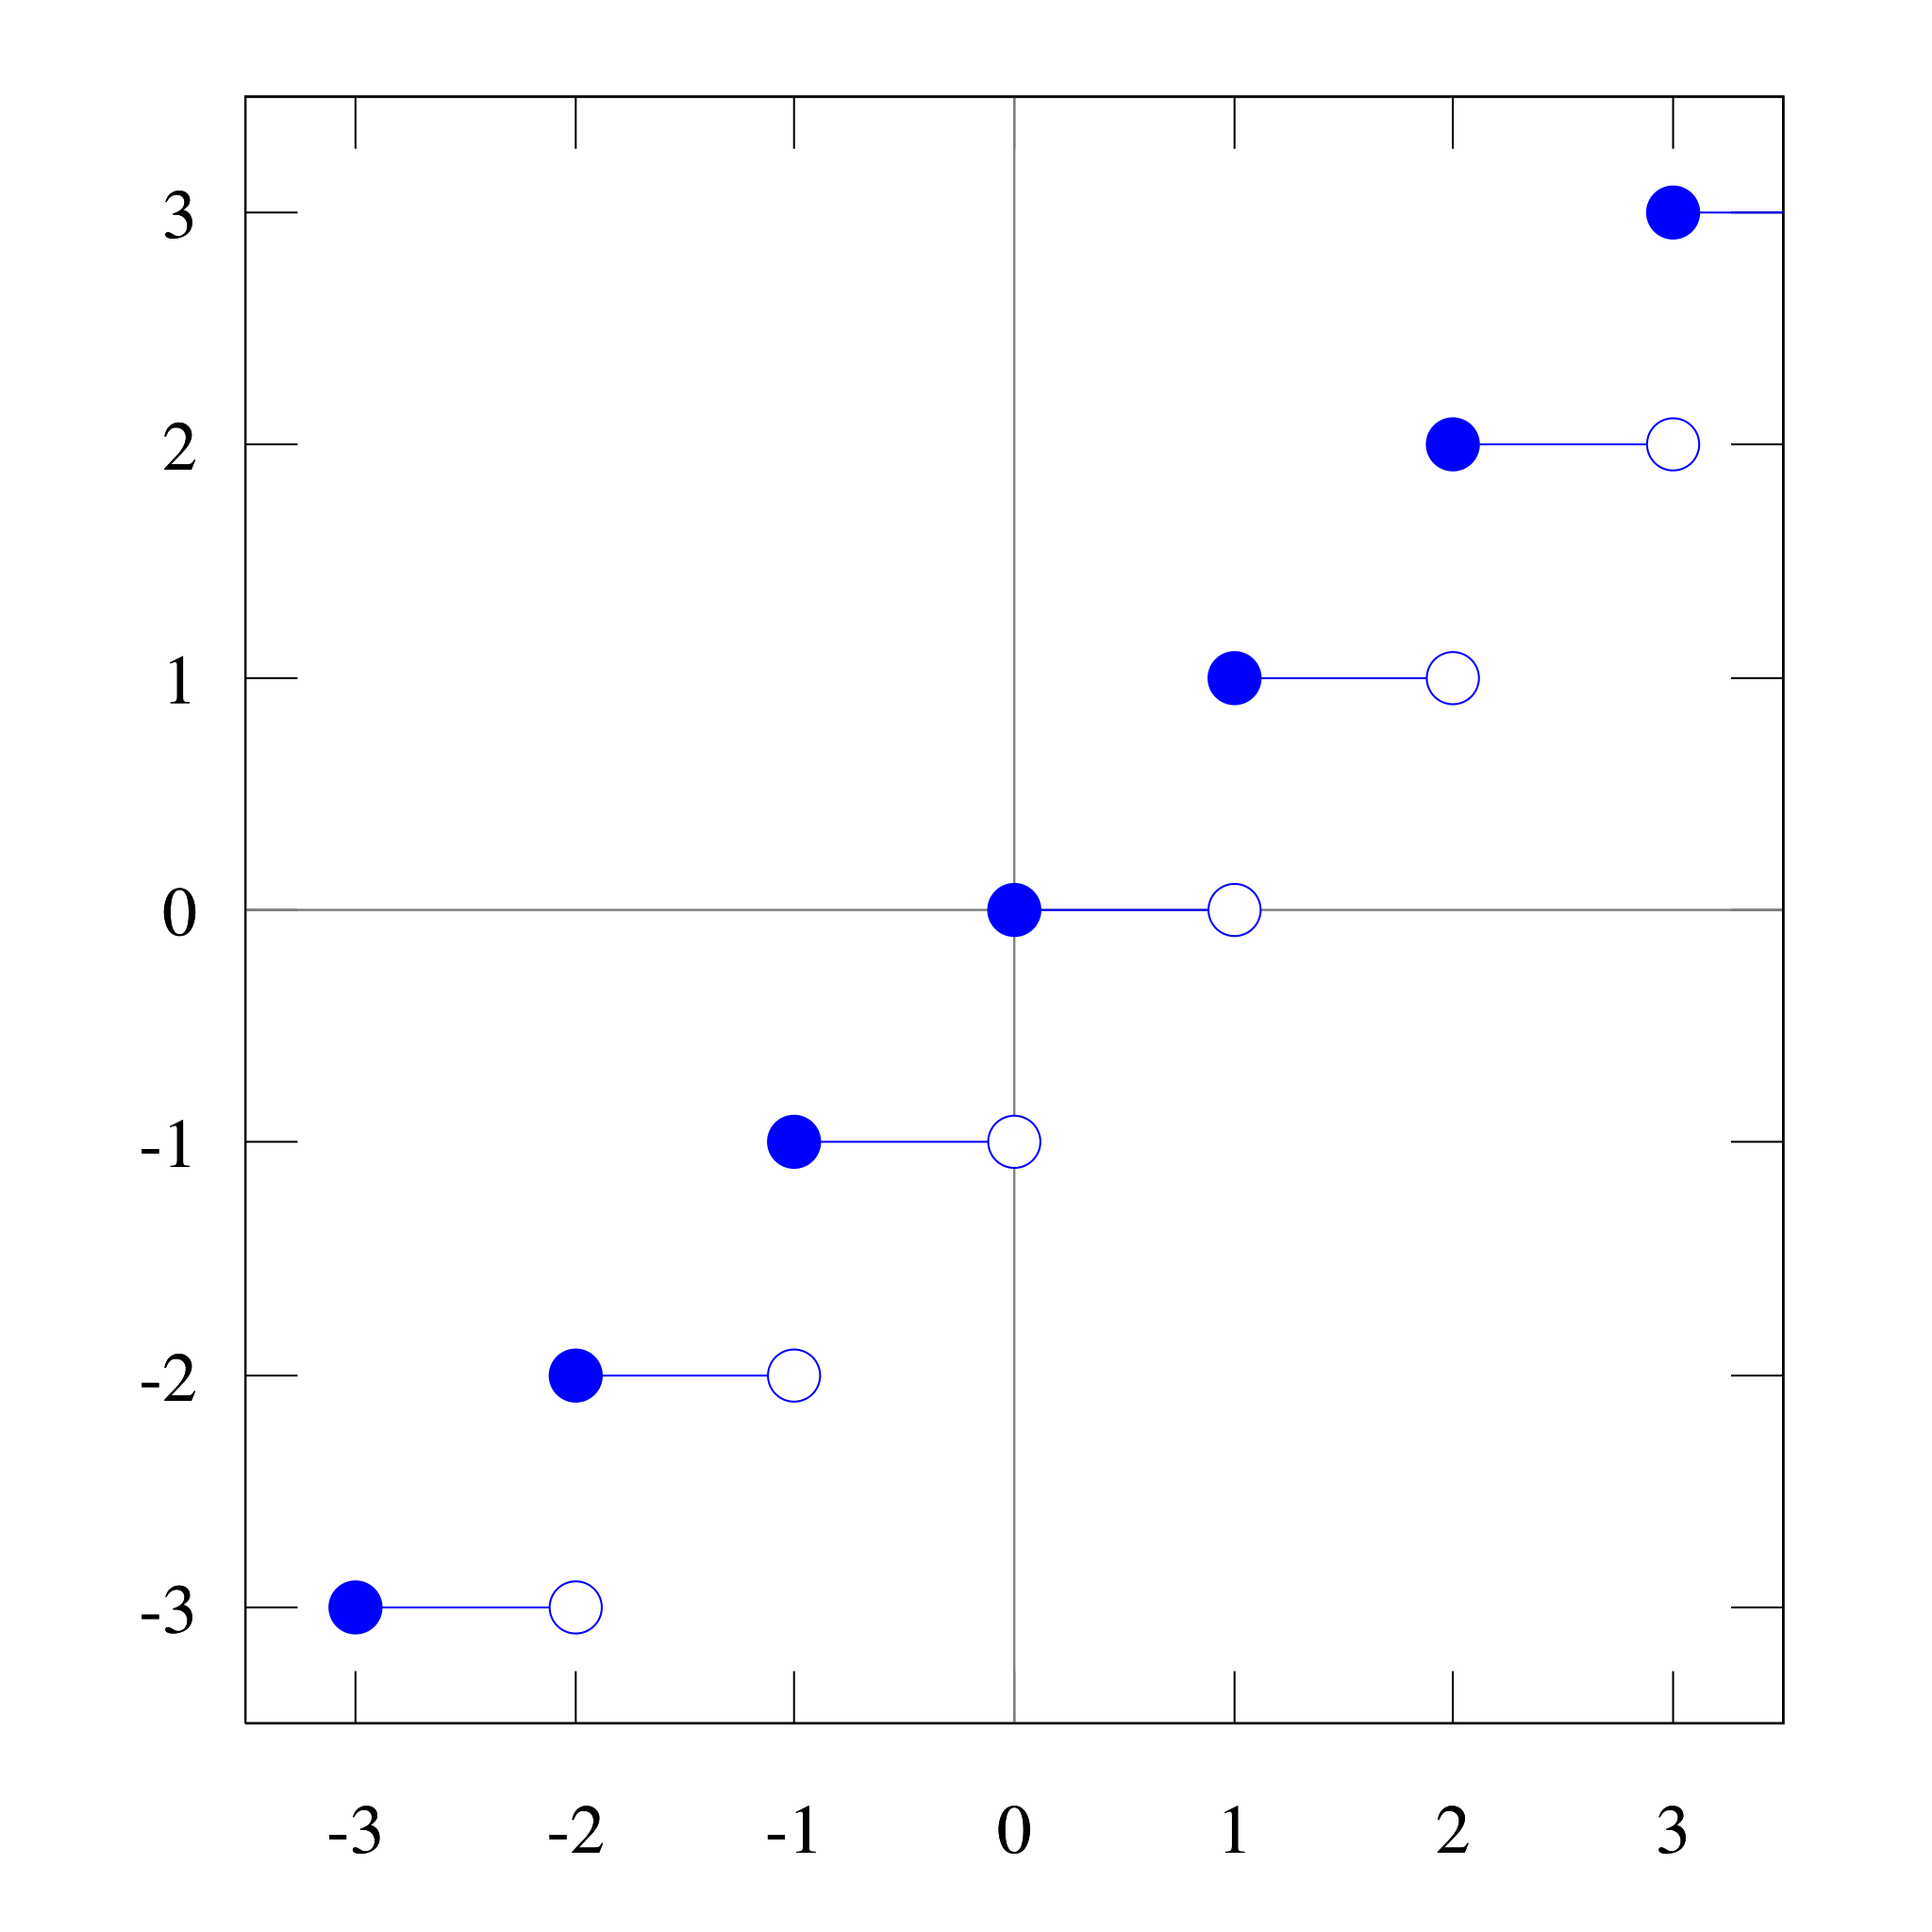
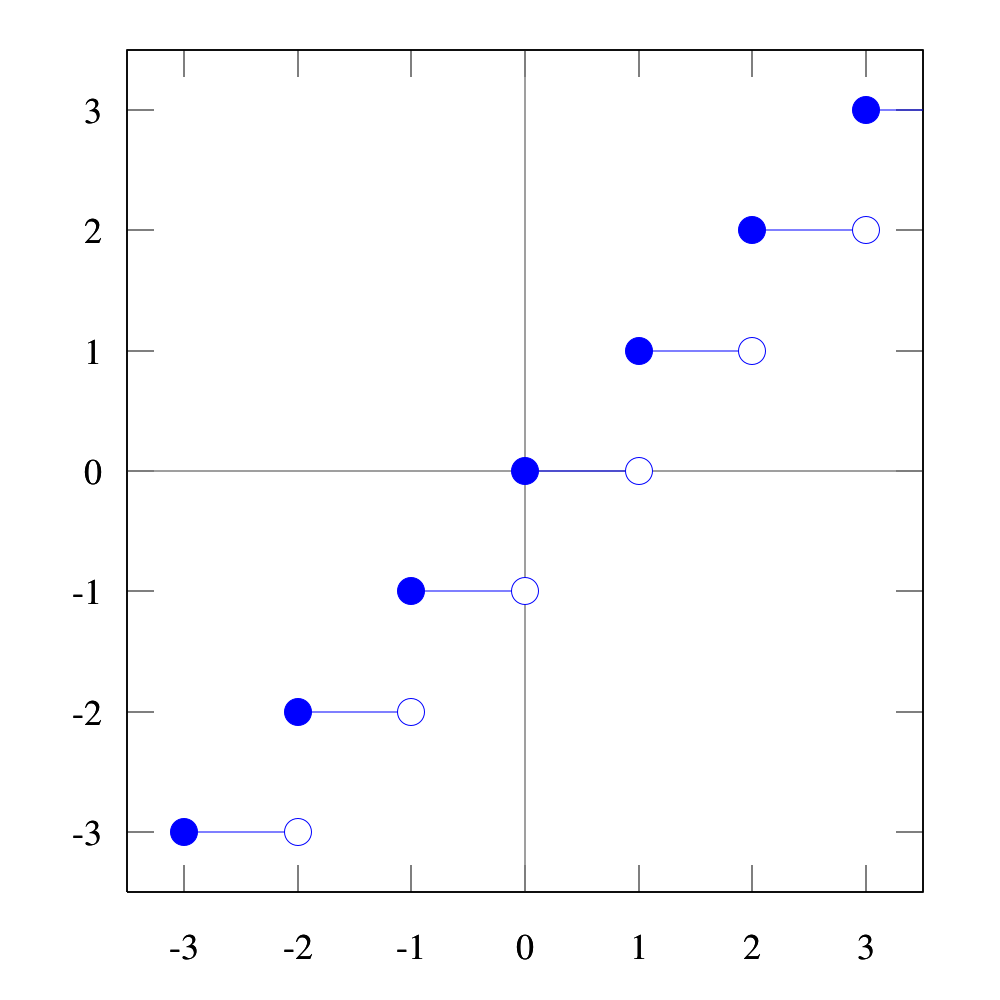
Tiedosto:Floor function.svg
Siirry navigaatioon
Siirry hakuun

Tämän PNG-esikatselun koko koskien SVG-tiedostoa: 600 × 600 kuvapistettä. Muut resoluutiot: 240 × 240 kuvapistettä | 480 × 480 kuvapistettä | 768 × 768 kuvapistettä | 1 024 × 1 024 kuvapistettä | 2 048 × 2 048 kuvapistettä | 1 000 × 1 000 kuvapistettä.
Alkuperäinen tiedosto (SVG-tiedosto; oletustarkkuus 1 000 × 1 000 kuvapistettä; tiedostokoko 16 KiB)
Yhteenveto
| Kuvaus | |
| Päiväys | 30. maaliskuuta 2006 (alkuperäinen tallennuspäivä) |
| Lähde | Oma teos |
| Tekijä | Koneluettavaa tekijää ei ole ilmoitettu. Oletettavasti Omegatron (keskustelu · muokkaukset) (tekijänoikeusilmoitukseen perustuen). |
| Muut versiot |
|
| SVG kehittely |


Lisenssi
Created by User:Omegatron using gnuplot, possibly with post-processing in the GIMP (PNG) or Inkscape (SVG)
Minä, tämän teoksen tekijänoikeuksien haltija, julkaisen täten tämän teoksen seuraavilla lisensseillä:
Tämä tiedosto on lisensoitu Creative Commons Nimeä-JaaSamoin 3.0 Ei sovitettu, 2.5 Yleinen, 2.0 Yleinen ja 1.0 Yleinen -lisensseillä.
- Voit:
- jakaa – kopioida, levittää ja esittää teosta
- remiksata – valmistaa muutettuja teoksia
- Seuraavilla ehdoilla:
- nimeäminen – Sinun on mainittava lähde asianmukaisesti, tarjottava linkki lisenssiin sekä merkittävä, mikäli olet tehnyt muutoksia. Voit tehdä yllä olevan millä tahansa kohtuullisella tavalla, mutta et siten, että annat ymmärtää lisenssinantajan suosittelevan sinua tai teoksen käyttöäsi.
- jaa samoin – Jos muutat tai perustat tähän työhön, voit jakaa tuloksena syntyvää työtä vain tällä tai tämän kaltaisella lisenssillä.

|
Voit kopioida, levittää ja/tai muuttaa tätä asiakirjaa GNU Free Documentation License -lisenssin version 1.2 tai minkä tahansa Free Software Foundationin julkaiseman myöhemmän version ehtojen alaisena; ei koske muuttumattomia kohtia, etukannen tekstejä eikä takakannen tekstejä. Kopio tästä lisenssistä on saatavilla osiossa GNU Free Documentation License. |
Voit valita haluamasi lisenssin.
(In short, this means that you can copy and modify the image freely as long as you provide attribution; preferably in the form of a link back to this page.)
Instructions
See Wikipedia graph-making tips.
 # Set square 1000×1000 SVG output and filename
 # The font size (fsize) sets the size for the circles, too.
 set terminal svg enhanced size 1000 1000 fname "Times" fsize 36
 set output "floor.svg"

 # Set the text value for missing entries in the data file, so we can plot a [[w:discontinuous function|discontinuous function]]
 set datafile missing "Skip"

 # Set y axis limits so the plot doesn't go right to the edges of the graph
 set yrange [-3.5:3.5]
 # Set x axis limits so the first and last points are hidden
 set xrange [-3.5:3.5]

 # No legend needed
 set nokey

 # Add lightly-colored axis lines
 set yzeroaxis
 set xzeroaxis

 # Plot as lines and also points (circles)
 plot "floor.dat" with lines
 plot "floor.dat" with points 1 6

 # Close the file (so I don't have to close gnuplot to view it)
 set output
and data file:
floor.dat
#  X     Y1
   -3    -4
   Skip
   -3    -3
   -2    -3
   Skip
   -2    -2
   -1    -2
   Skip
   -1    -1
   0     -1
   Skip
   0     0
   1     0
   Skip
   1     1
   2     1
   Skip
   2     2
   3     2
   Skip
   3     3
   4     3
Then I opened the resulting SVG file in Inkscape, changed the fill style for the circles (either blue or white fill), brought the plot lines to the top, and then brought the circles to the top (over the lines).
External links
Tiedoston historia
Päiväystä napsauttamalla näet, millainen tiedosto oli kyseisellä hetkellä.
| Päiväys | Pienoiskuva | Koko | Käyttäjä | Kommentti | |
|---|---|---|---|---|---|
| nykyinen | 22. toukokuuta 2006 kello 01.05 | | 1 000 × 1 000 (16 KiB) | wikimediacommons>Omegatron | i like blue better |
Tiedoston käyttö
Seuraava sivu käyttää tätä tiedostoa: